Review


Structured Review

Merck & Co mouse α brca1
(A) Selected results of a gene essentiality screen in <t>BRCA1-proficient</t> and -deficient RPE1 cells ( Adam et al. , 2021 ). Plotted is the CCA score: a higher score indicates a unique essentiality in BRCA1-deficient cells compared to -proficient cells. Dashed line indicates the cut-off for a significant CCA score (based on Adam et al. , 2021 ). (B) RPE1 hTERT cells expressing Cas9, either TP53 -/- (black lines) or TP53 -/- BRCA1 -/- (blue lines), were infected with indicated sgRNA together with GFP, or with an empty vector together with mCherry. GFP- and mCherry-positive cells were mixed 1:1, and the frequency of GFP-positive cells in the population was determined at multiple time points (n=4, mean±SEM). Western blot of lysates shown in supplemental figure 1A. (C) RPE1 hTERT PAC -/- TP53 -/- cells were genetically modified to generate a BRCA1-mAID-GFP fusion gene at the endogenous BRCA1 -locus. In this genetic background, two clonal EXO1 -/- cell lines were generated using gene editing techniques. Cells were treated with auxin (500 μM) for 48 hours or left untreated, and lysates were analysed by western blotting. (D) The cell lines described in were treated with 500 μM auxin, or left untreated, and clonogenic survival was determined. Lower panel shows a representative experiment, top panel shows the quantification (n=4, mean+SEM, *p<0.05, **p<0.01, paired t-test). (E) BRCA1 -mutated MDA-MB-436 cells, either WT or reconstituted with BRCA1, were infected with empty vector (CTRL) or EXO1 -targeting sgRNA and viability was measured using CellTiter-Glo (n=3, mean+SD, **p<0.01, paired t-test). (F) Lysates of the MDA-MB-436 cell lines described in were analysed by western blotting. (G) RPE1 hTERT TP53 -/- BRCA1-mAID-GFP cell lines were virally transduced to express Cas9 cDNA and the indicated gRNAs, followed by a clonogenic survival assay in presence or absence of 500 μM Auxin (n=3, mean+SD, **p<0.01, paired t-test). Western blot of lysates shown in supplemental figure 1L.
Mouse α Brca1, supplied by Merck & Co, used in various techniques. Bioz Stars score: 90/100, based on 1 PubMed citations. ZERO BIAS - scores, article reviews, protocol conditions and more
https://www.bioz.com/result/mouse α brca1/product/Merck & Co
Average 90 stars, based on 1 article reviews
mouse α brca1 - by Bioz Stars, 2026-03
90/100 stars

Images

1) Product Images from "EXO1-mediated DNA repair by single-strand annealing is essential for BRCA1-deficient cells"

Article Title: EXO1-mediated DNA repair by single-strand annealing is essential for BRCA1-deficient cells

Journal: bioRxiv

doi: 10.1101/2023.02.24.529205

(A) Selected results of a gene essentiality screen in BRCA1-proficient and -deficient RPE1 cells ( Adam et al. , 2021 ). Plotted is the CCA score: a higher score indicates a unique essentiality in BRCA1-deficient cells compared to -proficient cells. Dashed line indicates the cut-off for a significant CCA score (based on Adam et al. , 2021 ). (B) RPE1 hTERT cells expressing Cas9, either TP53 -/- (black lines) or TP53 -/- BRCA1 -/- (blue lines), were infected with indicated sgRNA together with GFP, or with an empty vector together with mCherry. GFP- and mCherry-positive cells were mixed 1:1, and the frequency of GFP-positive cells in the population was determined at multiple time points (n=4, mean±SEM). Western blot of lysates shown in supplemental figure 1A. (C) RPE1 hTERT PAC -/- TP53 -/- cells were genetically modified to generate a BRCA1-mAID-GFP fusion gene at the endogenous BRCA1 -locus. In this genetic background, two clonal EXO1 -/- cell lines were generated using gene editing techniques. Cells were treated with auxin (500 μM) for 48 hours or left untreated, and lysates were analysed by western blotting. (D) The cell lines described in were treated with 500 μM auxin, or left untreated, and clonogenic survival was determined. Lower panel shows a representative experiment, top panel shows the quantification (n=4, mean+SEM, *p<0.05, **p<0.01, paired t-test). (E) BRCA1 -mutated MDA-MB-436 cells, either WT or reconstituted with BRCA1, were infected with empty vector (CTRL) or EXO1 -targeting sgRNA and viability was measured using CellTiter-Glo (n=3, mean+SD, **p<0.01, paired t-test). (F) Lysates of the MDA-MB-436 cell lines described in were analysed by western blotting. (G) RPE1 hTERT TP53 -/- BRCA1-mAID-GFP cell lines were virally transduced to express Cas9 cDNA and the indicated gRNAs, followed by a clonogenic survival assay in presence or absence of 500 μM Auxin (n=3, mean+SD, **p<0.01, paired t-test). Western blot of lysates shown in supplemental figure 1L.
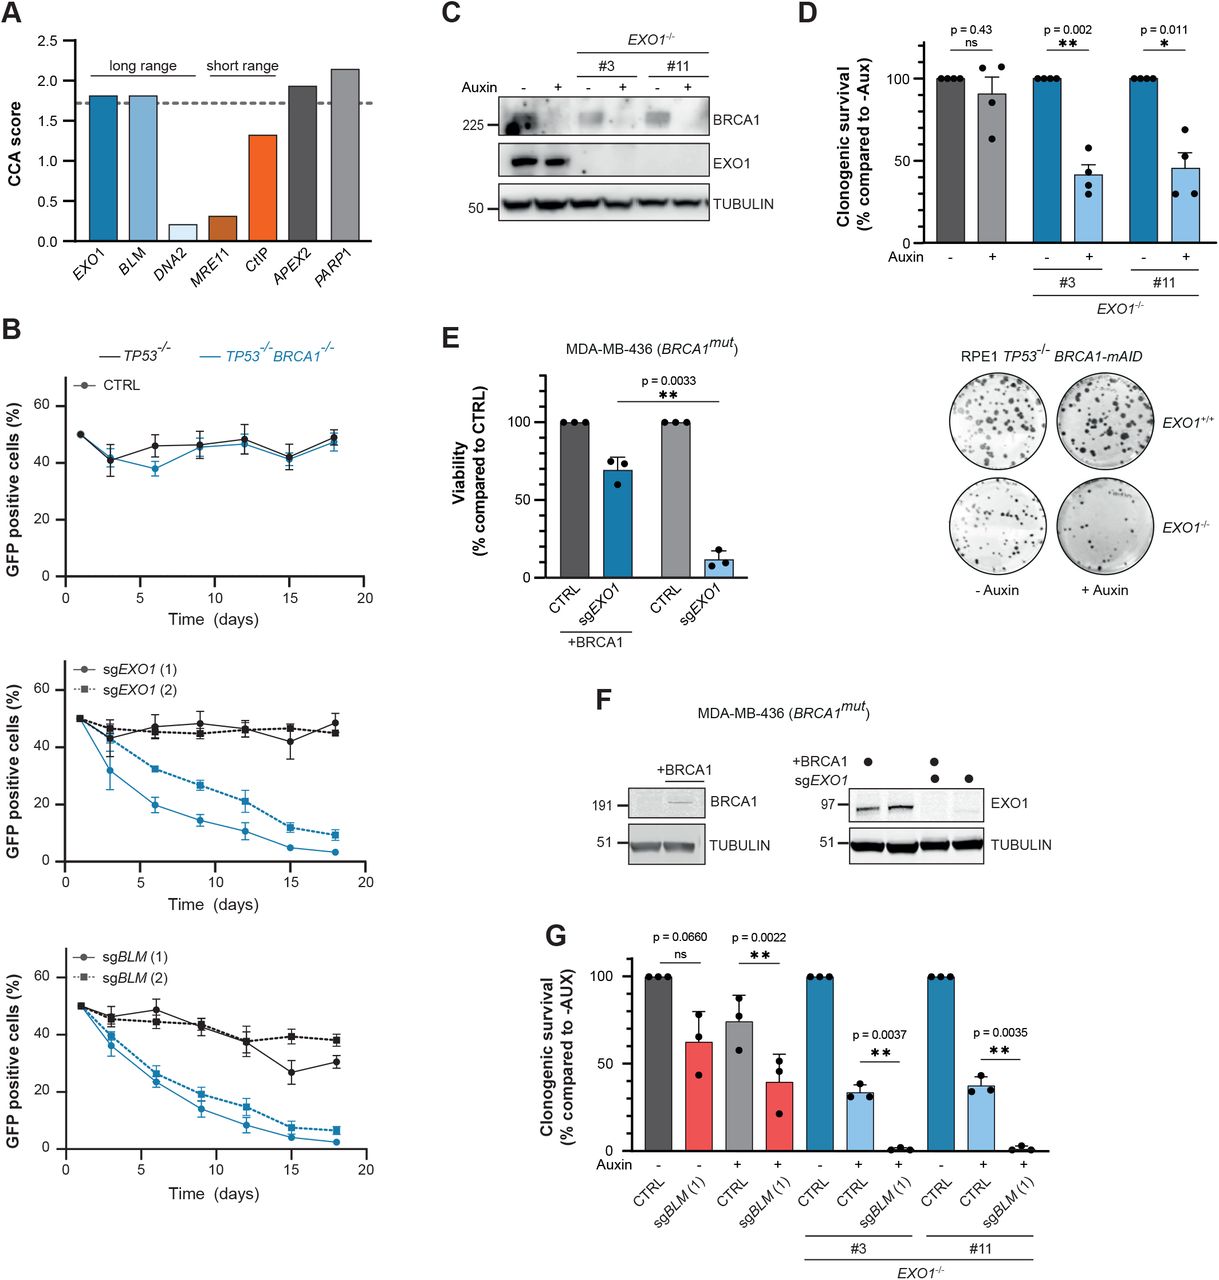
Figure Legend Snippet: (A) Selected results of a gene essentiality screen in BRCA1-proficient and -deficient RPE1 cells ( Adam et al. , 2021 ). Plotted is the CCA score: a higher score indicates a unique essentiality in BRCA1-deficient cells compared to -proficient cells. Dashed line indicates the cut-off for a significant CCA score (based on Adam et al. , 2021 ). (B) RPE1 hTERT cells expressing Cas9, either TP53 -/- (black lines) or TP53 -/- BRCA1 -/- (blue lines), were infected with indicated sgRNA together with GFP, or with an empty vector together with mCherry. GFP- and mCherry-positive cells were mixed 1:1, and the frequency of GFP-positive cells in the population was determined at multiple time points (n=4, mean±SEM). Western blot of lysates shown in supplemental figure 1A. (C) RPE1 hTERT PAC -/- TP53 -/- cells were genetically modified to generate a BRCA1-mAID-GFP fusion gene at the endogenous BRCA1 -locus. In this genetic background, two clonal EXO1 -/- cell lines were generated using gene editing techniques. Cells were treated with auxin (500 μM) for 48 hours or left untreated, and lysates were analysed by western blotting. (D) The cell lines described in were treated with 500 μM auxin, or left untreated, and clonogenic survival was determined. Lower panel shows a representative experiment, top panel shows the quantification (n=4, mean+SEM, *p<0.05, **p<0.01, paired t-test). (E) BRCA1 -mutated MDA-MB-436 cells, either WT or reconstituted with BRCA1, were infected with empty vector (CTRL) or EXO1 -targeting sgRNA and viability was measured using CellTiter-Glo (n=3, mean+SD, **p<0.01, paired t-test). (F) Lysates of the MDA-MB-436 cell lines described in were analysed by western blotting. (G) RPE1 hTERT TP53 -/- BRCA1-mAID-GFP cell lines were virally transduced to express Cas9 cDNA and the indicated gRNAs, followed by a clonogenic survival assay in presence or absence of 500 μM Auxin (n=3, mean+SD, **p<0.01, paired t-test). Western blot of lysates shown in supplemental figure 1L.

Techniques Used: Expressing, Infection, Plasmid Preparation, Western Blot, Genetically Modified, Generated, Clonogenic Cell Survival Assay

(A) Primary breast tumour samples (Staaf et al. 2019, n=247) were divided in groups based on the presence of biallelic BRCA1 mutations ( BRCA1 mut) or BRCA1 promotor hypermethylation ( BRCA1 prom. MET), and gene expression of indicated genes were plotted. (B) As in , but for another cohort of breast cancer patients in which groups were divided on the presence of deleterious BRCA1 mutations ( Nik-Zainal et al. , 2016 , n=342). (C) For tumour samples of the TCGA breast cancer dataset (n=1,048), the correlation between the HRD score and expression level of an individual gene was determined. Plotted are the Pearson correlation coefficient for each of 60,000 measured transcripts. (D) HRD score and expression of the indicated genes were plotted for each tumour sample in the TCGA breast cancer dataset (n=1,048). Red line is the linear regression curve, PC=Pearson correlation coefficient.
Figure Legend Snippet: (A) Primary breast tumour samples (Staaf et al. 2019, n=247) were divided in groups based on the presence of biallelic BRCA1 mutations ( BRCA1 mut) or BRCA1 promotor hypermethylation ( BRCA1 prom. MET), and gene expression of indicated genes were plotted. (B) As in , but for another cohort of breast cancer patients in which groups were divided on the presence of deleterious BRCA1 mutations ( Nik-Zainal et al. , 2016 , n=342). (C) For tumour samples of the TCGA breast cancer dataset (n=1,048), the correlation between the HRD score and expression level of an individual gene was determined. Plotted are the Pearson correlation coefficient for each of 60,000 measured transcripts. (D) HRD score and expression of the indicated genes were plotted for each tumour sample in the TCGA breast cancer dataset (n=1,048). Red line is the linear regression curve, PC=Pearson correlation coefficient.

Techniques Used: Expressing

(A) RPE1 hTERT TP53 -/- BRCA1-mAID-GFP cells, either EXO1 +/+ or EXO1 -/- , were treated with 500 μM auxin for 48 hours to deplete BRCA1 or left untreated. This was followed by Hoechst staining and microscopic quantification of the number of micronuclei (n=5, mean+SD, *p<0.05, ratio paired t-test). (B) RPE1 hTERT TP53 -/- BRCA1 -/- cells expressing Cas9 were infected with sgEXO1 . Next, DAPI-stained nuclei were analysed by microscopy to quantify the number of micronuclei (n=3, mean+SD, ratio paired t-test). (C) RPE1 hTERT TP53 -/- BRCA1-mAID-GFP , either EXO1 +/+ or EXO1 -/- , were treated with 500 μM auxin for 48 hours to deplete BRCA1 or left untreated. Next, metaphase spreads were analysed for chromosomal aberrations. Right panel shows a representative experiment with blue arrows indicating aberrations, left panel shows the quantification (n=3, >40 metaphases per replicate, mean). (D) Data depicted in panel C was re-plotted to show the absolute number of chromosomal aberrations, either chromatid type or chromosome type. (E) RPE1 hTERT TP53 -/- BRCA1-mAID-GFP cells, either EXO1 +/+ or EXO1 -/- , were treated with 500 μM auxin for 48 hours to deplete BRCA1 or left untreated. Nuclear γH2AX intensity in S-phase (EdU + ) cells was analysed by IF microscopy. A representative of two independent experiments is shown, black line indicates median (****p<0.0001, Mann-Whitney). (F) Nuclear γH2AX intensity in S-phase (EdU + ) cells analysed by IF microscopy in BRCA1 -mutated MDA-MB-436 cells, either WT or reconstituted with BRCA1 cDNA, infected with empty vector (CTRL) or EXO1-targeting shRNA. A representative of two independent experiments is shown, black line indicates median (****p<0.0001, Mann-Whitney).
Figure Legend Snippet: (A) RPE1 hTERT TP53 -/- BRCA1-mAID-GFP cells, either EXO1 +/+ or EXO1 -/- , were treated with 500 μM auxin for 48 hours to deplete BRCA1 or left untreated. This was followed by Hoechst staining and microscopic quantification of the number of micronuclei (n=5, mean+SD, *p<0.05, ratio paired t-test). (B) RPE1 hTERT TP53 -/- BRCA1 -/- cells expressing Cas9 were infected with sgEXO1 . Next, DAPI-stained nuclei were analysed by microscopy to quantify the number of micronuclei (n=3, mean+SD, ratio paired t-test). (C) RPE1 hTERT TP53 -/- BRCA1-mAID-GFP , either EXO1 +/+ or EXO1 -/- , were treated with 500 μM auxin for 48 hours to deplete BRCA1 or left untreated. Next, metaphase spreads were analysed for chromosomal aberrations. Right panel shows a representative experiment with blue arrows indicating aberrations, left panel shows the quantification (n=3, >40 metaphases per replicate, mean). (D) Data depicted in panel C was re-plotted to show the absolute number of chromosomal aberrations, either chromatid type or chromosome type. (E) RPE1 hTERT TP53 -/- BRCA1-mAID-GFP cells, either EXO1 +/+ or EXO1 -/- , were treated with 500 μM auxin for 48 hours to deplete BRCA1 or left untreated. Nuclear γH2AX intensity in S-phase (EdU + ) cells was analysed by IF microscopy. A representative of two independent experiments is shown, black line indicates median (****p<0.0001, Mann-Whitney). (F) Nuclear γH2AX intensity in S-phase (EdU + ) cells analysed by IF microscopy in BRCA1 -mutated MDA-MB-436 cells, either WT or reconstituted with BRCA1 cDNA, infected with empty vector (CTRL) or EXO1-targeting shRNA. A representative of two independent experiments is shown, black line indicates median (****p<0.0001, Mann-Whitney).

Techniques Used: Staining, Expressing, Infection, Microscopy, MANN-WHITNEY, Plasmid Preparation, shRNA

(A) RPE1 hTERT TP53 -/- BRCA1 -/- cells expressing Cas9, either TP53BP1 +/+ or TP53BP1 -/- , were transduced with an AAVS1-targeting (CTRL) or EXO1 -targeting sgRNA, followed by a clonogenic survival assay (n=3, mean+SD, **p<0.01, paired t-test). Western blot of lysates shown in supplemental figure 2A. (B) Indicated RPE1 cell lines were incubated with EdU and PARGi for 30 minutes, followed by IF microscopy to analyse PAR formation in EdU-positive cells. A representative of two independent experiments is shown, black line indicates median (****p<0.0001, Mann-Whitney). (C) As in , but for BRCA1 -mutated MDA-MB-436 cells, either WT or reconstituted with BRCA1 cDNA, infected with empty vector (CTRL) or EXO1 -targeting sgRNA. A representative of three independent experiments is shown, black line indicates median (****p<0.0001, Mann-Whitney). (D) As in , but for DLD1 cells, either WT or BRCA2 -/- . A representative of three independent experiments is shown, black line indicates median (****p<0.0001, Mann-Whitney).
Figure Legend Snippet: (A) RPE1 hTERT TP53 -/- BRCA1 -/- cells expressing Cas9, either TP53BP1 +/+ or TP53BP1 -/- , were transduced with an AAVS1-targeting (CTRL) or EXO1 -targeting sgRNA, followed by a clonogenic survival assay (n=3, mean+SD, **p<0.01, paired t-test). Western blot of lysates shown in supplemental figure 2A. (B) Indicated RPE1 cell lines were incubated with EdU and PARGi for 30 minutes, followed by IF microscopy to analyse PAR formation in EdU-positive cells. A representative of two independent experiments is shown, black line indicates median (****p<0.0001, Mann-Whitney). (C) As in , but for BRCA1 -mutated MDA-MB-436 cells, either WT or reconstituted with BRCA1 cDNA, infected with empty vector (CTRL) or EXO1 -targeting sgRNA. A representative of three independent experiments is shown, black line indicates median (****p<0.0001, Mann-Whitney). (D) As in , but for DLD1 cells, either WT or BRCA2 -/- . A representative of three independent experiments is shown, black line indicates median (****p<0.0001, Mann-Whitney).

Techniques Used: Expressing, Transduction, Clonogenic Cell Survival Assay, Western Blot, Incubation, Microscopy, MANN-WHITNEY, Infection, Plasmid Preparation

(A) Results of a gene essentiality screen in BRCA1-proficient and -deficient cells ( Adam et al. , 2021 ) were mined to extract the CCA scores for the indicated genes. A higher CCA score indicates a unique essentiality in BRCA1-deficient cells compared to proficient cells. Dashed line indicates the cut-off for a significant CCA score (based on Adam et al. , 2021 ). (B) Indicated RPE1 cells were transfected with a control (siCTRL) or EXO1 -targeting siRNA, followed by treatment with IR and subsequent IF microscopy to analyse either RAD51 or RAD52 foci formation. Left panel shows quantification (n=3, mean+SD, *p<0.05, paired t-test) and right panel shows representative microscopy images of eGFP-RAD52 foci. Western blot of lysates shown in supplemental figure 3A. (C) Clonogenic survival assay of Cas9-expressing RPE1 hTERT TP53 -/- BRCA1 -/- cells that were transduced to express the indicated sgRNAs (n=3, mean+SD, *p<0.05, **p<0.01, one-way ANOVA, post-hoc Dunnett’s, compared to CTRL). Western blot of lysates shown in supplemental figure 3D. (D) HEK 293T cells carrying the DSB-Spectrum_V3 reporter, either WT or EXO1 -/- , were transfected with indicated siRNAs, followed by a second round of transfection with a Cas9 cDNA and BFP sgRNA targeting the reporter locus. Next, cells were analysed by flow cytometry to quantify repair by the indicated pathways (n=4, mean±SEM, *p<0.05, ratio paired t-test). Western blot of lysates shown in supplemental figure 3E. (E) Nuclear γH2AX intensity in S-phase (EdU + ) cells analysed by IF microscopy in BRCA2 -/- cells infected with empty vector or sgEXO1 . A representative of two independent experiments is shown, black line indicates median.
Figure Legend Snippet: (A) Results of a gene essentiality screen in BRCA1-proficient and -deficient cells ( Adam et al. , 2021 ) were mined to extract the CCA scores for the indicated genes. A higher CCA score indicates a unique essentiality in BRCA1-deficient cells compared to proficient cells. Dashed line indicates the cut-off for a significant CCA score (based on Adam et al. , 2021 ). (B) Indicated RPE1 cells were transfected with a control (siCTRL) or EXO1 -targeting siRNA, followed by treatment with IR and subsequent IF microscopy to analyse either RAD51 or RAD52 foci formation. Left panel shows quantification (n=3, mean+SD, *p<0.05, paired t-test) and right panel shows representative microscopy images of eGFP-RAD52 foci. Western blot of lysates shown in supplemental figure 3A. (C) Clonogenic survival assay of Cas9-expressing RPE1 hTERT TP53 -/- BRCA1 -/- cells that were transduced to express the indicated sgRNAs (n=3, mean+SD, *p<0.05, **p<0.01, one-way ANOVA, post-hoc Dunnett’s, compared to CTRL). Western blot of lysates shown in supplemental figure 3D. (D) HEK 293T cells carrying the DSB-Spectrum_V3 reporter, either WT or EXO1 -/- , were transfected with indicated siRNAs, followed by a second round of transfection with a Cas9 cDNA and BFP sgRNA targeting the reporter locus. Next, cells were analysed by flow cytometry to quantify repair by the indicated pathways (n=4, mean±SEM, *p<0.05, ratio paired t-test). Western blot of lysates shown in supplemental figure 3E. (E) Nuclear γH2AX intensity in S-phase (EdU + ) cells analysed by IF microscopy in BRCA2 -/- cells infected with empty vector or sgEXO1 . A representative of two independent experiments is shown, black line indicates median.

Techniques Used: Transfection, Microscopy, Western Blot, Clonogenic Cell Survival Assay, Expressing, Flow Cytometry, Infection, Plasmid Preparation

(A) Model of the mechanism causing synthetic lethality between BRCA1-deficiency and EXO1 loss. (B) Whole genome sequencing data of pan cancer tumour samples ( Martínez-Jiménez et al. , 2022 ) was analysed to quantify the number of genetic scars indicative of DSB-repair by SSA, here defined as deletions flanked by homologous sequences of >10bp. CHORD analysis was used to classify samples as HR-proficient or HR-deficient, either BRCA1-type or BRCA2-type ( Nguyen et al. , 2020 ) (****p<0.0001, kolmogornov-smirnov). (C) Tumour samples from a pan-cancer cohort were binned based on SSA scar count, and the EXO1 expression was plotted for each tumour sample. (D) EXO1 expression levels in BRCA1 WT or BRCA1 mutant pan-cancer tumour samples.
Figure Legend Snippet: (A) Model of the mechanism causing synthetic lethality between BRCA1-deficiency and EXO1 loss. (B) Whole genome sequencing data of pan cancer tumour samples ( Martínez-Jiménez et al. , 2022 ) was analysed to quantify the number of genetic scars indicative of DSB-repair by SSA, here defined as deletions flanked by homologous sequences of >10bp. CHORD analysis was used to classify samples as HR-proficient or HR-deficient, either BRCA1-type or BRCA2-type ( Nguyen et al. , 2020 ) (****p<0.0001, kolmogornov-smirnov). (C) Tumour samples from a pan-cancer cohort were binned based on SSA scar count, and the EXO1 expression was plotted for each tumour sample. (D) EXO1 expression levels in BRCA1 WT or BRCA1 mutant pan-cancer tumour samples.

Techniques Used: Sequencing, Expressing, Mutagenesis


Similar Products

90
Merck & Co mouse α brca1
(A) Selected results of a gene essentiality screen in <t>BRCA1-proficient</t> and -deficient RPE1 cells ( Adam et al. , 2021 ). Plotted is the CCA score: a higher score indicates a unique essentiality in BRCA1-deficient cells compared to -proficient cells. Dashed line indicates the cut-off for a significant CCA score (based on Adam et al. , 2021 ). (B) RPE1 hTERT cells expressing Cas9, either TP53 -/- (black lines) or TP53 -/- BRCA1 -/- (blue lines), were infected with indicated sgRNA together with GFP, or with an empty vector together with mCherry. GFP- and mCherry-positive cells were mixed 1:1, and the frequency of GFP-positive cells in the population was determined at multiple time points (n=4, mean±SEM). Western blot of lysates shown in supplemental figure 1A. (C) RPE1 hTERT PAC -/- TP53 -/- cells were genetically modified to generate a BRCA1-mAID-GFP fusion gene at the endogenous BRCA1 -locus. In this genetic background, two clonal EXO1 -/- cell lines were generated using gene editing techniques. Cells were treated with auxin (500 μM) for 48 hours or left untreated, and lysates were analysed by western blotting. (D) The cell lines described in were treated with 500 μM auxin, or left untreated, and clonogenic survival was determined. Lower panel shows a representative experiment, top panel shows the quantification (n=4, mean+SEM, *p<0.05, **p<0.01, paired t-test). (E) BRCA1 -mutated MDA-MB-436 cells, either WT or reconstituted with BRCA1, were infected with empty vector (CTRL) or EXO1 -targeting sgRNA and viability was measured using CellTiter-Glo (n=3, mean+SD, **p<0.01, paired t-test). (F) Lysates of the MDA-MB-436 cell lines described in were analysed by western blotting. (G) RPE1 hTERT TP53 -/- BRCA1-mAID-GFP cell lines were virally transduced to express Cas9 cDNA and the indicated gRNAs, followed by a clonogenic survival assay in presence or absence of 500 μM Auxin (n=3, mean+SD, **p<0.01, paired t-test). Western blot of lysates shown in supplemental figure 1L.
Mouse α Brca1, supplied by Merck & Co, used in various techniques. Bioz Stars score: 90/100, based on 1 PubMed citations. ZERO BIAS - scores, article reviews, protocol conditions and more
https://www.bioz.com/result/mouse α brca1/product/Merck & Co
Average 90 stars, based on 1 article reviews
mouse α brca1 - by Bioz Stars, 2026-03
90/100 stars
  Buy from Supplier

96
Santa Cruz Biotechnology mouse monoclonal α brca1 antibody
(A) Selected results of a gene essentiality screen in <t>BRCA1-proficient</t> and -deficient RPE1 cells ( Adam et al. , 2021 ). Plotted is the CCA score: a higher score indicates a unique essentiality in BRCA1-deficient cells compared to -proficient cells. Dashed line indicates the cut-off for a significant CCA score (based on Adam et al. , 2021 ). (B) RPE1 hTERT cells expressing Cas9, either TP53 -/- (black lines) or TP53 -/- BRCA1 -/- (blue lines), were infected with indicated sgRNA together with GFP, or with an empty vector together with mCherry. GFP- and mCherry-positive cells were mixed 1:1, and the frequency of GFP-positive cells in the population was determined at multiple time points (n=4, mean±SEM). Western blot of lysates shown in supplemental figure 1A. (C) RPE1 hTERT PAC -/- TP53 -/- cells were genetically modified to generate a BRCA1-mAID-GFP fusion gene at the endogenous BRCA1 -locus. In this genetic background, two clonal EXO1 -/- cell lines were generated using gene editing techniques. Cells were treated with auxin (500 μM) for 48 hours or left untreated, and lysates were analysed by western blotting. (D) The cell lines described in were treated with 500 μM auxin, or left untreated, and clonogenic survival was determined. Lower panel shows a representative experiment, top panel shows the quantification (n=4, mean+SEM, *p<0.05, **p<0.01, paired t-test). (E) BRCA1 -mutated MDA-MB-436 cells, either WT or reconstituted with BRCA1, were infected with empty vector (CTRL) or EXO1 -targeting sgRNA and viability was measured using CellTiter-Glo (n=3, mean+SD, **p<0.01, paired t-test). (F) Lysates of the MDA-MB-436 cell lines described in were analysed by western blotting. (G) RPE1 hTERT TP53 -/- BRCA1-mAID-GFP cell lines were virally transduced to express Cas9 cDNA and the indicated gRNAs, followed by a clonogenic survival assay in presence or absence of 500 μM Auxin (n=3, mean+SD, **p<0.01, paired t-test). Western blot of lysates shown in supplemental figure 1L.
Mouse Monoclonal α Brca1 Antibody, supplied by Santa Cruz Biotechnology, used in various techniques. Bioz Stars score: 96/100, based on 1 PubMed citations. ZERO BIAS - scores, article reviews, protocol conditions and more
https://www.bioz.com/result/mouse monoclonal α brca1 antibody/product/Santa Cruz Biotechnology
Average 96 stars, based on 1 article reviews
mouse monoclonal α brca1 antibody - by Bioz Stars, 2026-03
96/100 stars
  Buy from Supplier

90
Santa Cruz Biotechnology mouse monoclonal α-brca1 antibody sc-6954
(A) Selected results of a gene essentiality screen in <t>BRCA1-proficient</t> and -deficient RPE1 cells ( Adam et al. , 2021 ). Plotted is the CCA score: a higher score indicates a unique essentiality in BRCA1-deficient cells compared to -proficient cells. Dashed line indicates the cut-off for a significant CCA score (based on Adam et al. , 2021 ). (B) RPE1 hTERT cells expressing Cas9, either TP53 -/- (black lines) or TP53 -/- BRCA1 -/- (blue lines), were infected with indicated sgRNA together with GFP, or with an empty vector together with mCherry. GFP- and mCherry-positive cells were mixed 1:1, and the frequency of GFP-positive cells in the population was determined at multiple time points (n=4, mean±SEM). Western blot of lysates shown in supplemental figure 1A. (C) RPE1 hTERT PAC -/- TP53 -/- cells were genetically modified to generate a BRCA1-mAID-GFP fusion gene at the endogenous BRCA1 -locus. In this genetic background, two clonal EXO1 -/- cell lines were generated using gene editing techniques. Cells were treated with auxin (500 μM) for 48 hours or left untreated, and lysates were analysed by western blotting. (D) The cell lines described in were treated with 500 μM auxin, or left untreated, and clonogenic survival was determined. Lower panel shows a representative experiment, top panel shows the quantification (n=4, mean+SEM, *p<0.05, **p<0.01, paired t-test). (E) BRCA1 -mutated MDA-MB-436 cells, either WT or reconstituted with BRCA1, were infected with empty vector (CTRL) or EXO1 -targeting sgRNA and viability was measured using CellTiter-Glo (n=3, mean+SD, **p<0.01, paired t-test). (F) Lysates of the MDA-MB-436 cell lines described in were analysed by western blotting. (G) RPE1 hTERT TP53 -/- BRCA1-mAID-GFP cell lines were virally transduced to express Cas9 cDNA and the indicated gRNAs, followed by a clonogenic survival assay in presence or absence of 500 μM Auxin (n=3, mean+SD, **p<0.01, paired t-test). Western blot of lysates shown in supplemental figure 1L.
Mouse Monoclonal α Brca1 Antibody Sc 6954, supplied by Santa Cruz Biotechnology, used in various techniques. Bioz Stars score: 90/100, based on 1 PubMed citations. ZERO BIAS - scores, article reviews, protocol conditions and more
https://www.bioz.com/result/mouse monoclonal α-brca1 antibody sc-6954/product/Santa Cruz Biotechnology
Average 90 stars, based on 1 article reviews
mouse monoclonal α-brca1 antibody sc-6954 - by Bioz Stars, 2026-03
90/100 stars
  Buy from Supplier

96
Santa Cruz Biotechnology mouse monoclonal α actin
(A) Selected results of a gene essentiality screen in <t>BRCA1-proficient</t> and -deficient RPE1 cells ( Adam et al. , 2021 ). Plotted is the CCA score: a higher score indicates a unique essentiality in BRCA1-deficient cells compared to -proficient cells. Dashed line indicates the cut-off for a significant CCA score (based on Adam et al. , 2021 ). (B) RPE1 hTERT cells expressing Cas9, either TP53 -/- (black lines) or TP53 -/- BRCA1 -/- (blue lines), were infected with indicated sgRNA together with GFP, or with an empty vector together with mCherry. GFP- and mCherry-positive cells were mixed 1:1, and the frequency of GFP-positive cells in the population was determined at multiple time points (n=4, mean±SEM). Western blot of lysates shown in supplemental figure 1A. (C) RPE1 hTERT PAC -/- TP53 -/- cells were genetically modified to generate a BRCA1-mAID-GFP fusion gene at the endogenous BRCA1 -locus. In this genetic background, two clonal EXO1 -/- cell lines were generated using gene editing techniques. Cells were treated with auxin (500 μM) for 48 hours or left untreated, and lysates were analysed by western blotting. (D) The cell lines described in were treated with 500 μM auxin, or left untreated, and clonogenic survival was determined. Lower panel shows a representative experiment, top panel shows the quantification (n=4, mean+SEM, *p<0.05, **p<0.01, paired t-test). (E) BRCA1 -mutated MDA-MB-436 cells, either WT or reconstituted with BRCA1, were infected with empty vector (CTRL) or EXO1 -targeting sgRNA and viability was measured using CellTiter-Glo (n=3, mean+SD, **p<0.01, paired t-test). (F) Lysates of the MDA-MB-436 cell lines described in were analysed by western blotting. (G) RPE1 hTERT TP53 -/- BRCA1-mAID-GFP cell lines were virally transduced to express Cas9 cDNA and the indicated gRNAs, followed by a clonogenic survival assay in presence or absence of 500 μM Auxin (n=3, mean+SD, **p<0.01, paired t-test). Western blot of lysates shown in supplemental figure 1L.
Mouse Monoclonal α Actin, supplied by Santa Cruz Biotechnology, used in various techniques. Bioz Stars score: 96/100, based on 1 PubMed citations. ZERO BIAS - scores, article reviews, protocol conditions and more
https://www.bioz.com/result/mouse monoclonal α actin/product/Santa Cruz Biotechnology
Average 96 stars, based on 1 article reviews
mouse monoclonal α actin - by Bioz Stars, 2026-03
96/100 stars
  Buy from Supplier

96
Santa Cruz Biotechnology mouse α brca1
Recruitment of DNA repair factors to double-strand breaks is impaired in splicing-deficient cells. ( a ) HeLa Luc-I or Luc cells were exposed to DMSO (control), 100 nM pladienolide B or 50 μ M isoginkgetin for 1–16 h. After normalization to the corresponding DMSO value, the ratio between Luc-I and Luc luciferase activity is presented as a percentage. Means±S.D. are shown, n =4. ( b ) U2OS cells were treated with pladienolide B or isoginkgetin for 2, 6 or 16 h, irradiated (6 Gy, 1 h recovery) 1 h prior to termination of the treatment, fixed and immunostained for γH2AX, MDC1, WRAP53 β , RNF168, conjugated ubiquitin recognized by the FK2 antibody, 53BP1, RAD51 or <t>BRCA1.</t> Nuclei were stained with DAPI in all immunofluorescence experiments. The numbers in white represent the percentage of 100–200 cells counted whose nuclei contained >10 IR-induced foci. Means±S.D. are shown, n =3. * P -value<0.05, as determined by a non-paired two-tailed Student's t -test. The ‘foci-like' accumulations RAD51 after splicing inhibition in ( b ) are not IR-induced foci, but accumulation of RAD51 in the nucleolus for unknown reasons
Mouse α Brca1, supplied by Santa Cruz Biotechnology, used in various techniques. Bioz Stars score: 96/100, based on 1 PubMed citations. ZERO BIAS - scores, article reviews, protocol conditions and more
https://www.bioz.com/result/mouse α brca1/product/Santa Cruz Biotechnology
Average 96 stars, based on 1 article reviews
mouse α brca1 - by Bioz Stars, 2026-03
96/100 stars
  Buy from Supplier

96
Santa Cruz Biotechnology α brca1 mouse monoclonal
Recruitment of DNA repair factors to double-strand breaks is impaired in splicing-deficient cells. ( a ) HeLa Luc-I or Luc cells were exposed to DMSO (control), 100 nM pladienolide B or 50 μ M isoginkgetin for 1–16 h. After normalization to the corresponding DMSO value, the ratio between Luc-I and Luc luciferase activity is presented as a percentage. Means±S.D. are shown, n =4. ( b ) U2OS cells were treated with pladienolide B or isoginkgetin for 2, 6 or 16 h, irradiated (6 Gy, 1 h recovery) 1 h prior to termination of the treatment, fixed and immunostained for γH2AX, MDC1, WRAP53 β , RNF168, conjugated ubiquitin recognized by the FK2 antibody, 53BP1, RAD51 or <t>BRCA1.</t> Nuclei were stained with DAPI in all immunofluorescence experiments. The numbers in white represent the percentage of 100–200 cells counted whose nuclei contained >10 IR-induced foci. Means±S.D. are shown, n =3. * P -value<0.05, as determined by a non-paired two-tailed Student's t -test. The ‘foci-like' accumulations RAD51 after splicing inhibition in ( b ) are not IR-induced foci, but accumulation of RAD51 in the nucleolus for unknown reasons
α Brca1 Mouse Monoclonal, supplied by Santa Cruz Biotechnology, used in various techniques. Bioz Stars score: 96/100, based on 1 PubMed citations. ZERO BIAS - scores, article reviews, protocol conditions and more
https://www.bioz.com/result/α brca1 mouse monoclonal/product/Santa Cruz Biotechnology
Average 96 stars, based on 1 article reviews
α brca1 mouse monoclonal - by Bioz Stars, 2026-03
96/100 stars
  Buy from Supplier

Image Search Results


(A) Selected results of a gene essentiality screen in BRCA1-proficient and -deficient RPE1 cells ( Adam et al. , 2021 ). Plotted is the CCA score: a higher score indicates a unique essentiality in BRCA1-deficient cells compared to -proficient cells. Dashed line indicates the cut-off for a significant CCA score (based on Adam et al. , 2021 ). (B) RPE1 hTERT cells expressing Cas9, either TP53 -/- (black lines) or TP53 -/- BRCA1 -/- (blue lines), were infected with indicated sgRNA together with GFP, or with an empty vector together with mCherry. GFP- and mCherry-positive cells were mixed 1:1, and the frequency of GFP-positive cells in the population was determined at multiple time points (n=4, mean±SEM). Western blot of lysates shown in supplemental figure 1A. (C) RPE1 hTERT PAC -/- TP53 -/- cells were genetically modified to generate a BRCA1-mAID-GFP fusion gene at the endogenous BRCA1 -locus. In this genetic background, two clonal EXO1 -/- cell lines were generated using gene editing techniques. Cells were treated with auxin (500 μM) for 48 hours or left untreated, and lysates were analysed by western blotting. (D) The cell lines described in were treated with 500 μM auxin, or left untreated, and clonogenic survival was determined. Lower panel shows a representative experiment, top panel shows the quantification (n=4, mean+SEM, *p<0.05, **p<0.01, paired t-test). (E) BRCA1 -mutated MDA-MB-436 cells, either WT or reconstituted with BRCA1, were infected with empty vector (CTRL) or EXO1 -targeting sgRNA and viability was measured using CellTiter-Glo (n=3, mean+SD, **p<0.01, paired t-test). (F) Lysates of the MDA-MB-436 cell lines described in were analysed by western blotting. (G) RPE1 hTERT TP53 -/- BRCA1-mAID-GFP cell lines were virally transduced to express Cas9 cDNA and the indicated gRNAs, followed by a clonogenic survival assay in presence or absence of 500 μM Auxin (n=3, mean+SD, **p<0.01, paired t-test). Western blot of lysates shown in supplemental figure 1L.

Journal: bioRxiv

Article Title: EXO1-mediated DNA repair by single-strand annealing is essential for BRCA1-deficient cells

doi: 10.1101/2023.02.24.529205

Figure Lengend Snippet: (A) Selected results of a gene essentiality screen in BRCA1-proficient and -deficient RPE1 cells ( Adam et al. , 2021 ). Plotted is the CCA score: a higher score indicates a unique essentiality in BRCA1-deficient cells compared to -proficient cells. Dashed line indicates the cut-off for a significant CCA score (based on Adam et al. , 2021 ). (B) RPE1 hTERT cells expressing Cas9, either TP53 -/- (black lines) or TP53 -/- BRCA1 -/- (blue lines), were infected with indicated sgRNA together with GFP, or with an empty vector together with mCherry. GFP- and mCherry-positive cells were mixed 1:1, and the frequency of GFP-positive cells in the population was determined at multiple time points (n=4, mean±SEM). Western blot of lysates shown in supplemental figure 1A. (C) RPE1 hTERT PAC -/- TP53 -/- cells were genetically modified to generate a BRCA1-mAID-GFP fusion gene at the endogenous BRCA1 -locus. In this genetic background, two clonal EXO1 -/- cell lines were generated using gene editing techniques. Cells were treated with auxin (500 μM) for 48 hours or left untreated, and lysates were analysed by western blotting. (D) The cell lines described in were treated with 500 μM auxin, or left untreated, and clonogenic survival was determined. Lower panel shows a representative experiment, top panel shows the quantification (n=4, mean+SEM, *p<0.05, **p<0.01, paired t-test). (E) BRCA1 -mutated MDA-MB-436 cells, either WT or reconstituted with BRCA1, were infected with empty vector (CTRL) or EXO1 -targeting sgRNA and viability was measured using CellTiter-Glo (n=3, mean+SD, **p<0.01, paired t-test). (F) Lysates of the MDA-MB-436 cell lines described in were analysed by western blotting. (G) RPE1 hTERT TP53 -/- BRCA1-mAID-GFP cell lines were virally transduced to express Cas9 cDNA and the indicated gRNAs, followed by a clonogenic survival assay in presence or absence of 500 μM Auxin (n=3, mean+SD, **p<0.01, paired t-test). Western blot of lysates shown in supplemental figure 1L.

Article Snippet: The following primary antibodies were used for western blotting: Mouse α 53BP1 (BD 612522; 1:1,500), Rabbit α BLM (Abcam ab2179; 1:2,000), Mouse α BRCA1 (Merck OP92; 1:1,000), Rabbit α BRCA1 (Millipore 07-434; 1:2,000), Mouse α BRCA2 (Merck OP95; 1:1,000), Mouse α CTIP (Millipore MABE1060; 1:1,000), Rabbit α EXO1 (Abcam ab95068; 1:1,000), Rabbit α EXO1 (Millipore ABE1354; 1:1,000), Mouse α GFP (Sigma #11814460001; 1:1000), Rabbit α MRE11 (1:3,000; de Jager et al., 2001), Mouse α TUBULIN (Sigma T6199; 1:5,000), and Mouse α RAD52 (Santa-Cruz sc-365341; 1:100).

Techniques: Expressing, Infection, Plasmid Preparation, Western Blot, Genetically Modified, Generated, Clonogenic Cell Survival Assay

(A) Primary breast tumour samples (Staaf et al. 2019, n=247) were divided in groups based on the presence of biallelic BRCA1 mutations ( BRCA1 mut) or BRCA1 promotor hypermethylation ( BRCA1 prom. MET), and gene expression of indicated genes were plotted. (B) As in , but for another cohort of breast cancer patients in which groups were divided on the presence of deleterious BRCA1 mutations ( Nik-Zainal et al. , 2016 , n=342). (C) For tumour samples of the TCGA breast cancer dataset (n=1,048), the correlation between the HRD score and expression level of an individual gene was determined. Plotted are the Pearson correlation coefficient for each of 60,000 measured transcripts. (D) HRD score and expression of the indicated genes were plotted for each tumour sample in the TCGA breast cancer dataset (n=1,048). Red line is the linear regression curve, PC=Pearson correlation coefficient.

Journal: bioRxiv

Article Title: EXO1-mediated DNA repair by single-strand annealing is essential for BRCA1-deficient cells

doi: 10.1101/2023.02.24.529205

Figure Lengend Snippet: (A) Primary breast tumour samples (Staaf et al. 2019, n=247) were divided in groups based on the presence of biallelic BRCA1 mutations ( BRCA1 mut) or BRCA1 promotor hypermethylation ( BRCA1 prom. MET), and gene expression of indicated genes were plotted. (B) As in , but for another cohort of breast cancer patients in which groups were divided on the presence of deleterious BRCA1 mutations ( Nik-Zainal et al. , 2016 , n=342). (C) For tumour samples of the TCGA breast cancer dataset (n=1,048), the correlation between the HRD score and expression level of an individual gene was determined. Plotted are the Pearson correlation coefficient for each of 60,000 measured transcripts. (D) HRD score and expression of the indicated genes were plotted for each tumour sample in the TCGA breast cancer dataset (n=1,048). Red line is the linear regression curve, PC=Pearson correlation coefficient.

Article Snippet: The following primary antibodies were used for western blotting: Mouse α 53BP1 (BD 612522; 1:1,500), Rabbit α BLM (Abcam ab2179; 1:2,000), Mouse α BRCA1 (Merck OP92; 1:1,000), Rabbit α BRCA1 (Millipore 07-434; 1:2,000), Mouse α BRCA2 (Merck OP95; 1:1,000), Mouse α CTIP (Millipore MABE1060; 1:1,000), Rabbit α EXO1 (Abcam ab95068; 1:1,000), Rabbit α EXO1 (Millipore ABE1354; 1:1,000), Mouse α GFP (Sigma #11814460001; 1:1000), Rabbit α MRE11 (1:3,000; de Jager et al., 2001), Mouse α TUBULIN (Sigma T6199; 1:5,000), and Mouse α RAD52 (Santa-Cruz sc-365341; 1:100).

Techniques: Expressing

(A) RPE1 hTERT TP53 -/- BRCA1-mAID-GFP cells, either EXO1 +/+ or EXO1 -/- , were treated with 500 μM auxin for 48 hours to deplete BRCA1 or left untreated. This was followed by Hoechst staining and microscopic quantification of the number of micronuclei (n=5, mean+SD, *p<0.05, ratio paired t-test). (B) RPE1 hTERT TP53 -/- BRCA1 -/- cells expressing Cas9 were infected with sgEXO1 . Next, DAPI-stained nuclei were analysed by microscopy to quantify the number of micronuclei (n=3, mean+SD, ratio paired t-test). (C) RPE1 hTERT TP53 -/- BRCA1-mAID-GFP , either EXO1 +/+ or EXO1 -/- , were treated with 500 μM auxin for 48 hours to deplete BRCA1 or left untreated. Next, metaphase spreads were analysed for chromosomal aberrations. Right panel shows a representative experiment with blue arrows indicating aberrations, left panel shows the quantification (n=3, >40 metaphases per replicate, mean). (D) Data depicted in panel C was re-plotted to show the absolute number of chromosomal aberrations, either chromatid type or chromosome type. (E) RPE1 hTERT TP53 -/- BRCA1-mAID-GFP cells, either EXO1 +/+ or EXO1 -/- , were treated with 500 μM auxin for 48 hours to deplete BRCA1 or left untreated. Nuclear γH2AX intensity in S-phase (EdU + ) cells was analysed by IF microscopy. A representative of two independent experiments is shown, black line indicates median (****p<0.0001, Mann-Whitney). (F) Nuclear γH2AX intensity in S-phase (EdU + ) cells analysed by IF microscopy in BRCA1 -mutated MDA-MB-436 cells, either WT or reconstituted with BRCA1 cDNA, infected with empty vector (CTRL) or EXO1-targeting shRNA. A representative of two independent experiments is shown, black line indicates median (****p<0.0001, Mann-Whitney).

Journal: bioRxiv

Article Title: EXO1-mediated DNA repair by single-strand annealing is essential for BRCA1-deficient cells

doi: 10.1101/2023.02.24.529205

Figure Lengend Snippet: (A) RPE1 hTERT TP53 -/- BRCA1-mAID-GFP cells, either EXO1 +/+ or EXO1 -/- , were treated with 500 μM auxin for 48 hours to deplete BRCA1 or left untreated. This was followed by Hoechst staining and microscopic quantification of the number of micronuclei (n=5, mean+SD, *p<0.05, ratio paired t-test). (B) RPE1 hTERT TP53 -/- BRCA1 -/- cells expressing Cas9 were infected with sgEXO1 . Next, DAPI-stained nuclei were analysed by microscopy to quantify the number of micronuclei (n=3, mean+SD, ratio paired t-test). (C) RPE1 hTERT TP53 -/- BRCA1-mAID-GFP , either EXO1 +/+ or EXO1 -/- , were treated with 500 μM auxin for 48 hours to deplete BRCA1 or left untreated. Next, metaphase spreads were analysed for chromosomal aberrations. Right panel shows a representative experiment with blue arrows indicating aberrations, left panel shows the quantification (n=3, >40 metaphases per replicate, mean). (D) Data depicted in panel C was re-plotted to show the absolute number of chromosomal aberrations, either chromatid type or chromosome type. (E) RPE1 hTERT TP53 -/- BRCA1-mAID-GFP cells, either EXO1 +/+ or EXO1 -/- , were treated with 500 μM auxin for 48 hours to deplete BRCA1 or left untreated. Nuclear γH2AX intensity in S-phase (EdU + ) cells was analysed by IF microscopy. A representative of two independent experiments is shown, black line indicates median (****p<0.0001, Mann-Whitney). (F) Nuclear γH2AX intensity in S-phase (EdU + ) cells analysed by IF microscopy in BRCA1 -mutated MDA-MB-436 cells, either WT or reconstituted with BRCA1 cDNA, infected with empty vector (CTRL) or EXO1-targeting shRNA. A representative of two independent experiments is shown, black line indicates median (****p<0.0001, Mann-Whitney).

Article Snippet: The following primary antibodies were used for western blotting: Mouse α 53BP1 (BD 612522; 1:1,500), Rabbit α BLM (Abcam ab2179; 1:2,000), Mouse α BRCA1 (Merck OP92; 1:1,000), Rabbit α BRCA1 (Millipore 07-434; 1:2,000), Mouse α BRCA2 (Merck OP95; 1:1,000), Mouse α CTIP (Millipore MABE1060; 1:1,000), Rabbit α EXO1 (Abcam ab95068; 1:1,000), Rabbit α EXO1 (Millipore ABE1354; 1:1,000), Mouse α GFP (Sigma #11814460001; 1:1000), Rabbit α MRE11 (1:3,000; de Jager et al., 2001), Mouse α TUBULIN (Sigma T6199; 1:5,000), and Mouse α RAD52 (Santa-Cruz sc-365341; 1:100).

Techniques: Staining, Expressing, Infection, Microscopy, MANN-WHITNEY, Plasmid Preparation, shRNA

(A) RPE1 hTERT TP53 -/- BRCA1 -/- cells expressing Cas9, either TP53BP1 +/+ or TP53BP1 -/- , were transduced with an AAVS1-targeting (CTRL) or EXO1 -targeting sgRNA, followed by a clonogenic survival assay (n=3, mean+SD, **p<0.01, paired t-test). Western blot of lysates shown in supplemental figure 2A. (B) Indicated RPE1 cell lines were incubated with EdU and PARGi for 30 minutes, followed by IF microscopy to analyse PAR formation in EdU-positive cells. A representative of two independent experiments is shown, black line indicates median (****p<0.0001, Mann-Whitney). (C) As in , but for BRCA1 -mutated MDA-MB-436 cells, either WT or reconstituted with BRCA1 cDNA, infected with empty vector (CTRL) or EXO1 -targeting sgRNA. A representative of three independent experiments is shown, black line indicates median (****p<0.0001, Mann-Whitney). (D) As in , but for DLD1 cells, either WT or BRCA2 -/- . A representative of three independent experiments is shown, black line indicates median (****p<0.0001, Mann-Whitney).

Journal: bioRxiv

Article Title: EXO1-mediated DNA repair by single-strand annealing is essential for BRCA1-deficient cells

doi: 10.1101/2023.02.24.529205

Figure Lengend Snippet: (A) RPE1 hTERT TP53 -/- BRCA1 -/- cells expressing Cas9, either TP53BP1 +/+ or TP53BP1 -/- , were transduced with an AAVS1-targeting (CTRL) or EXO1 -targeting sgRNA, followed by a clonogenic survival assay (n=3, mean+SD, **p<0.01, paired t-test). Western blot of lysates shown in supplemental figure 2A. (B) Indicated RPE1 cell lines were incubated with EdU and PARGi for 30 minutes, followed by IF microscopy to analyse PAR formation in EdU-positive cells. A representative of two independent experiments is shown, black line indicates median (****p<0.0001, Mann-Whitney). (C) As in , but for BRCA1 -mutated MDA-MB-436 cells, either WT or reconstituted with BRCA1 cDNA, infected with empty vector (CTRL) or EXO1 -targeting sgRNA. A representative of three independent experiments is shown, black line indicates median (****p<0.0001, Mann-Whitney). (D) As in , but for DLD1 cells, either WT or BRCA2 -/- . A representative of three independent experiments is shown, black line indicates median (****p<0.0001, Mann-Whitney).

Article Snippet: The following primary antibodies were used for western blotting: Mouse α 53BP1 (BD 612522; 1:1,500), Rabbit α BLM (Abcam ab2179; 1:2,000), Mouse α BRCA1 (Merck OP92; 1:1,000), Rabbit α BRCA1 (Millipore 07-434; 1:2,000), Mouse α BRCA2 (Merck OP95; 1:1,000), Mouse α CTIP (Millipore MABE1060; 1:1,000), Rabbit α EXO1 (Abcam ab95068; 1:1,000), Rabbit α EXO1 (Millipore ABE1354; 1:1,000), Mouse α GFP (Sigma #11814460001; 1:1000), Rabbit α MRE11 (1:3,000; de Jager et al., 2001), Mouse α TUBULIN (Sigma T6199; 1:5,000), and Mouse α RAD52 (Santa-Cruz sc-365341; 1:100).

Techniques: Expressing, Transduction, Clonogenic Cell Survival Assay, Western Blot, Incubation, Microscopy, MANN-WHITNEY, Infection, Plasmid Preparation

(A) Results of a gene essentiality screen in BRCA1-proficient and -deficient cells ( Adam et al. , 2021 ) were mined to extract the CCA scores for the indicated genes. A higher CCA score indicates a unique essentiality in BRCA1-deficient cells compared to proficient cells. Dashed line indicates the cut-off for a significant CCA score (based on Adam et al. , 2021 ). (B) Indicated RPE1 cells were transfected with a control (siCTRL) or EXO1 -targeting siRNA, followed by treatment with IR and subsequent IF microscopy to analyse either RAD51 or RAD52 foci formation. Left panel shows quantification (n=3, mean+SD, *p<0.05, paired t-test) and right panel shows representative microscopy images of eGFP-RAD52 foci. Western blot of lysates shown in supplemental figure 3A. (C) Clonogenic survival assay of Cas9-expressing RPE1 hTERT TP53 -/- BRCA1 -/- cells that were transduced to express the indicated sgRNAs (n=3, mean+SD, *p<0.05, **p<0.01, one-way ANOVA, post-hoc Dunnett’s, compared to CTRL). Western blot of lysates shown in supplemental figure 3D. (D) HEK 293T cells carrying the DSB-Spectrum_V3 reporter, either WT or EXO1 -/- , were transfected with indicated siRNAs, followed by a second round of transfection with a Cas9 cDNA and BFP sgRNA targeting the reporter locus. Next, cells were analysed by flow cytometry to quantify repair by the indicated pathways (n=4, mean±SEM, *p<0.05, ratio paired t-test). Western blot of lysates shown in supplemental figure 3E. (E) Nuclear γH2AX intensity in S-phase (EdU + ) cells analysed by IF microscopy in BRCA2 -/- cells infected with empty vector or sgEXO1 . A representative of two independent experiments is shown, black line indicates median.

Journal: bioRxiv

Article Title: EXO1-mediated DNA repair by single-strand annealing is essential for BRCA1-deficient cells

doi: 10.1101/2023.02.24.529205

Figure Lengend Snippet: (A) Results of a gene essentiality screen in BRCA1-proficient and -deficient cells ( Adam et al. , 2021 ) were mined to extract the CCA scores for the indicated genes. A higher CCA score indicates a unique essentiality in BRCA1-deficient cells compared to proficient cells. Dashed line indicates the cut-off for a significant CCA score (based on Adam et al. , 2021 ). (B) Indicated RPE1 cells were transfected with a control (siCTRL) or EXO1 -targeting siRNA, followed by treatment with IR and subsequent IF microscopy to analyse either RAD51 or RAD52 foci formation. Left panel shows quantification (n=3, mean+SD, *p<0.05, paired t-test) and right panel shows representative microscopy images of eGFP-RAD52 foci. Western blot of lysates shown in supplemental figure 3A. (C) Clonogenic survival assay of Cas9-expressing RPE1 hTERT TP53 -/- BRCA1 -/- cells that were transduced to express the indicated sgRNAs (n=3, mean+SD, *p<0.05, **p<0.01, one-way ANOVA, post-hoc Dunnett’s, compared to CTRL). Western blot of lysates shown in supplemental figure 3D. (D) HEK 293T cells carrying the DSB-Spectrum_V3 reporter, either WT or EXO1 -/- , were transfected with indicated siRNAs, followed by a second round of transfection with a Cas9 cDNA and BFP sgRNA targeting the reporter locus. Next, cells were analysed by flow cytometry to quantify repair by the indicated pathways (n=4, mean±SEM, *p<0.05, ratio paired t-test). Western blot of lysates shown in supplemental figure 3E. (E) Nuclear γH2AX intensity in S-phase (EdU + ) cells analysed by IF microscopy in BRCA2 -/- cells infected with empty vector or sgEXO1 . A representative of two independent experiments is shown, black line indicates median.

Article Snippet: The following primary antibodies were used for western blotting: Mouse α 53BP1 (BD 612522; 1:1,500), Rabbit α BLM (Abcam ab2179; 1:2,000), Mouse α BRCA1 (Merck OP92; 1:1,000), Rabbit α BRCA1 (Millipore 07-434; 1:2,000), Mouse α BRCA2 (Merck OP95; 1:1,000), Mouse α CTIP (Millipore MABE1060; 1:1,000), Rabbit α EXO1 (Abcam ab95068; 1:1,000), Rabbit α EXO1 (Millipore ABE1354; 1:1,000), Mouse α GFP (Sigma #11814460001; 1:1000), Rabbit α MRE11 (1:3,000; de Jager et al., 2001), Mouse α TUBULIN (Sigma T6199; 1:5,000), and Mouse α RAD52 (Santa-Cruz sc-365341; 1:100).

Techniques: Transfection, Microscopy, Western Blot, Clonogenic Cell Survival Assay, Expressing, Flow Cytometry, Infection, Plasmid Preparation

(A) Model of the mechanism causing synthetic lethality between BRCA1-deficiency and EXO1 loss. (B) Whole genome sequencing data of pan cancer tumour samples ( Martínez-Jiménez et al. , 2022 ) was analysed to quantify the number of genetic scars indicative of DSB-repair by SSA, here defined as deletions flanked by homologous sequences of >10bp. CHORD analysis was used to classify samples as HR-proficient or HR-deficient, either BRCA1-type or BRCA2-type ( Nguyen et al. , 2020 ) (****p<0.0001, kolmogornov-smirnov). (C) Tumour samples from a pan-cancer cohort were binned based on SSA scar count, and the EXO1 expression was plotted for each tumour sample. (D) EXO1 expression levels in BRCA1 WT or BRCA1 mutant pan-cancer tumour samples.

Journal: bioRxiv

Article Title: EXO1-mediated DNA repair by single-strand annealing is essential for BRCA1-deficient cells

doi: 10.1101/2023.02.24.529205

Figure Lengend Snippet: (A) Model of the mechanism causing synthetic lethality between BRCA1-deficiency and EXO1 loss. (B) Whole genome sequencing data of pan cancer tumour samples ( Martínez-Jiménez et al. , 2022 ) was analysed to quantify the number of genetic scars indicative of DSB-repair by SSA, here defined as deletions flanked by homologous sequences of >10bp. CHORD analysis was used to classify samples as HR-proficient or HR-deficient, either BRCA1-type or BRCA2-type ( Nguyen et al. , 2020 ) (****p<0.0001, kolmogornov-smirnov). (C) Tumour samples from a pan-cancer cohort were binned based on SSA scar count, and the EXO1 expression was plotted for each tumour sample. (D) EXO1 expression levels in BRCA1 WT or BRCA1 mutant pan-cancer tumour samples.

Article Snippet: The following primary antibodies were used for western blotting: Mouse α 53BP1 (BD 612522; 1:1,500), Rabbit α BLM (Abcam ab2179; 1:2,000), Mouse α BRCA1 (Merck OP92; 1:1,000), Rabbit α BRCA1 (Millipore 07-434; 1:2,000), Mouse α BRCA2 (Merck OP95; 1:1,000), Mouse α CTIP (Millipore MABE1060; 1:1,000), Rabbit α EXO1 (Abcam ab95068; 1:1,000), Rabbit α EXO1 (Millipore ABE1354; 1:1,000), Mouse α GFP (Sigma #11814460001; 1:1000), Rabbit α MRE11 (1:3,000; de Jager et al., 2001), Mouse α TUBULIN (Sigma T6199; 1:5,000), and Mouse α RAD52 (Santa-Cruz sc-365341; 1:100).

Techniques: Sequencing, Expressing, Mutagenesis

Recruitment of DNA repair factors to double-strand breaks is impaired in splicing-deficient cells. ( a ) HeLa Luc-I or Luc cells were exposed to DMSO (control), 100 nM pladienolide B or 50 μ M isoginkgetin for 1–16 h. After normalization to the corresponding DMSO value, the ratio between Luc-I and Luc luciferase activity is presented as a percentage. Means±S.D. are shown, n =4. ( b ) U2OS cells were treated with pladienolide B or isoginkgetin for 2, 6 or 16 h, irradiated (6 Gy, 1 h recovery) 1 h prior to termination of the treatment, fixed and immunostained for γH2AX, MDC1, WRAP53 β , RNF168, conjugated ubiquitin recognized by the FK2 antibody, 53BP1, RAD51 or BRCA1. Nuclei were stained with DAPI in all immunofluorescence experiments. The numbers in white represent the percentage of 100–200 cells counted whose nuclei contained >10 IR-induced foci. Means±S.D. are shown, n =3. * P -value<0.05, as determined by a non-paired two-tailed Student's t -test. The ‘foci-like' accumulations RAD51 after splicing inhibition in ( b ) are not IR-induced foci, but accumulation of RAD51 in the nucleolus for unknown reasons

Journal: Cell Death and Differentiation

Article Title: Splicing controls the ubiquitin response during DNA double-strand break repair

doi: 10.1038/cdd.2016.58

Figure Lengend Snippet: Recruitment of DNA repair factors to double-strand breaks is impaired in splicing-deficient cells. ( a ) HeLa Luc-I or Luc cells were exposed to DMSO (control), 100 nM pladienolide B or 50 μ M isoginkgetin for 1–16 h. After normalization to the corresponding DMSO value, the ratio between Luc-I and Luc luciferase activity is presented as a percentage. Means±S.D. are shown, n =4. ( b ) U2OS cells were treated with pladienolide B or isoginkgetin for 2, 6 or 16 h, irradiated (6 Gy, 1 h recovery) 1 h prior to termination of the treatment, fixed and immunostained for γH2AX, MDC1, WRAP53 β , RNF168, conjugated ubiquitin recognized by the FK2 antibody, 53BP1, RAD51 or BRCA1. Nuclei were stained with DAPI in all immunofluorescence experiments. The numbers in white represent the percentage of 100–200 cells counted whose nuclei contained >10 IR-induced foci. Means±S.D. are shown, n =3. * P -value<0.05, as determined by a non-paired two-tailed Student's t -test. The ‘foci-like' accumulations RAD51 after splicing inhibition in ( b ) are not IR-induced foci, but accumulation of RAD51 in the nucleolus for unknown reasons

Article Snippet: The following antibodies were utilized for immunofluorescent staining and western blotting: mouse α - γ H2AX (cat. no. 05-636, Millipore), rabbit α - γ H2AX (cat. no. 2577, Cell Signaling, Bionordika, Stockholm, Sweden), mouse α -MDC1 (cat. no. ab50003, Abcam, Cambridge, UK), mouse α -WDR79 (clone 1F12; used for immunofluorescent staining; Abnova, cat. no. 14761-1-AP, VWR International, Stockholm, Sweden), rabbit α -WRAP53-C2 (cat. no. PA-2020-100, Innovagen AB, Lund, Sweden), mouse α -RNF8 (cat. no. sc-271462, Santa Cruz Biotechnology), rabbit α -RNF168 (cat. no. ABE367, Millipore), mouse α -ubiquitin (FK2) (cat. no. ST1200, Calbiochem, Millipore), rabbit α -53BP1 (cat. no. NB100-904, Novus Biologicals, Bio-Techne, Abingdon, UK), mouse α -BRCA1 (cat. no. sc-6954, Santa Cruz Biotechnology), rabbit α -RAD51 (cat. no. ABE257, Millipore), mouse α -Ubiquitin (cat. no. sc-8017, Santa Cruz Biotechnology), rabbit α -H2A (cat. no. ab18255, Abcam), rabbit α -H2AX (cat. no. ab11175, Abcam), rabbit α -GFP (cat. no. ab290, Abcam), mouse α -HA (cat. no. 23675, Cell Signaling), mouse α - β -actin (cat. no. A5441, Sigma-Aldrich), rabbit α -SF3B1 (cat no. ab39578, Abcam), rabbit α -RBMX (cat. no. sc-48796, Santa Cruz Biotechnology) and mouse α -PRPF8 (cat.no. ab51366, Abcam).

Techniques: Control, Luciferase, Activity Assay, Irradiation, Ubiquitin Proteomics, Staining, Immunofluorescence, Two Tailed Test, Inhibition